Sounding Initialization
The sounding class supports the following
initialization modes:
- From a University of Wyoming txt file
- From a University of Wyoming Website
- Form an ARM sounding Netcdf file
- From a dictionary with the field names, field values pairs
- Adding individual fields manually
University of Wyoming Sounding Data
Fetch from txt file
The easiest way to get sounding data is to visit the University of Wyoming’s website:
http://weather.uwyo.edu/upperair/sounding.html
To get some sounding data, follow the link and find the date, and location you are interested in, view the data as a text file and just save the file to your system. If you want to get loads of data please be considerate about the way you go about doing this! (Lots of wget requests makes the server administrators unhappy).
You can also pass your own data to SkewT by writing a text file in identical format to the University of Wyoming files, which are constant-width columns. Here’s a sample of the first few lines of one of the bundled examples:
94975 YMHB Hobart Airport Observations at 00Z 02 Jul 2013

-----------------------------------------------------------------------------
   PRES   HGHT   TEMP   DWPT   RELH   MIXR   DRCT   SKNT   THTA   THTE   THTV
    hPa     m      C      C      %    g/kg    deg   knot     K      K      K
-----------------------------------------------------------------------------
 1004.0     27   12.0   10.2     89   7.84    330     14  284.8  306.7  286.2
 1000.0     56   12.4   10.3     87   7.92    325     16  285.6  307.8  286.9
  993.0    115   12.8    9.7     81   7.66    311     22  286.5  308.1  287.9
From now on, it’s assumed that the package is installed and the current working directory is the examples one, included in this package.
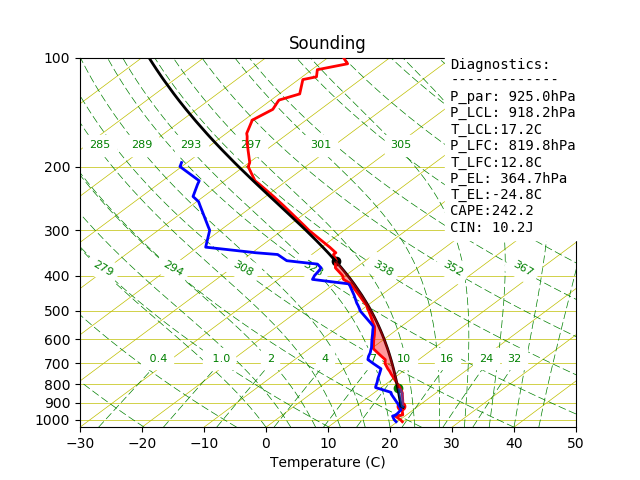
To read a sounding from a txt file and create a quick plot using the default parameters we only have to do:
from SkewTplus.sounding import sounding

#Load the sounding data
mySounding = sounding("./exampleSounding.txt",fileFormat='txt')

#Do a quick plot
mySounding.quickPlot()
The resulting plot will look like this:
Fetch from University Of Wyoming Website
The sounding class supports getting University of Wyoming sound data directly from the UWYO website, we only need to specify the date and the station id.
For example, to initialize the class with with the sounding from “72558 OAX Omaha” station, at April 10th of 2017 OO UTC we simple do:
from SkewTplus.sounding import sounding

#Load the sounding data
mySounding = sounding("20170410:00",fileFormat='web', stationId= "OAX")

#Do a quick plot
mySounding.quickPlot()
ARM Sounding Data
The sounding class also supports
initialization from ARM sounding data (Netcdf files). For example:
from SkewTplus.sounding import sounding

#Load the sounding data
mySounding = sounding("./armSoundingExample.cdf",fileFormat='arm')

#Do a quick plot
mySounding.quickPlot()
From a dictionary
The sounding class can be initialized from a dictionary
with “field names” , “field values” pairs.
The Temperature should be in Celsius degrees and the pressure in hPa.
The next is an example of a dictionary initialization used to plot a sounding from a WRF output file:
from netCDF4 import Dataset
import numpy
from SkewTplus.sounding import sounding

#Load the WRF File
wrfOutputFile = Dataset("wrfOutputExample.nc")
theta = wrfOutputFile.variables["T"][:] + 300 # Potential temperature

# Pressure in hPa
pressure = (wrfOutputFile.variables['P'][:] + wrfOutputFile.variables['PB'][:])


qvapor = wrfOutputFile.variables['QVAPOR'][:]

qvapor = numpy.ma.masked_where(qvapor <0.00002, qvapor)

T0 = 273.15
referencePressure = 100000.0  # [Pa]
epsilon = 0.622  # Rd / Rv

# Temperatures in Celsius
temperature = theta* numpy.power((pressure / referencePressure), 0.2854) - T0
vaporPressure = pressure * qvapor / (epsilon + qvapor)

dewPointTemperature = 243.5 / ((17.67 / numpy.log(vaporPressure * 0.01 / 6.112)) - 1.) #In celsius
dewPointTemperature = numpy.ma.masked_invalid(dewPointTemperature)


# Now we have the pressure, temperature and dew point temperature in the whole domain

# Select one vertical column , t =0 , x=30, y=30

inputData = dict(pressure=pressure[0,:,30,30]/100,
                 temperature=temperature[0,:,30,30],
                 dewPointTemperature=dewPointTemperature[0,:,30,30])

mySounding = sounding(inputData)
mySounding.quickPlot()
Adding Fields Manually
The sounding class supports an empty initialization (without any fields).
With the addField() method, new fields can be added to the class.
With this kind of initialization full control ever the fields added can be obtained.
Internally, the class stores the field data values as soundingArray classes.
This class is a MaskedArray with metadata (long Name,units and missing data value).
To exemplify the use of this initialization, the previous example of the sounding with WRF data coded to
use the addField() method:
from netCDF4 import Dataset
import numpy
from SkewTplus.sounding import sounding


#Load the WRF File
wrfOutputFile = Dataset("wrfOutputExample.nc")
theta = wrfOutputFile.variables["T"][:] + 300 # Potential temperature

# Pressure in hPa
pressure = (wrfOutputFile.variables['P'][:] + wrfOutputFile.variables['PB'][:])


qvapor = wrfOutputFile.variables['QVAPOR'][:]

qvapor = numpy.ma.masked_where(qvapor <0.00002, qvapor)

T0 = 273.15
referencePressure = 100000.0  # [Pa]
epsilon = 0.622  # Rd / Rv

# Temperatures in Celsius
temperature = theta* numpy.power((pressure / referencePressure), 0.2854) - T0
vaporPressure = pressure * qvapor / (epsilon + qvapor)

dewPointTemperature = 243.5 / ((17.67 / numpy.log(vaporPressure * 0.01 / 6.112)) - 1.) #In celsius
dewPointTemperature = numpy.ma.masked_invalid(dewPointTemperature)


# Now we have the pressure, temperature and dew point temperature in the whole domain

# Select one vertical column , t =0 , x=30, y=30

mySounding = sounding() # Create an empty sounding

#Add fields
mySounding.addField('pressure', pressure[0,:,30,30], "Pressure", "Pa")
mySounding.addField('temperature', temperature[0,:,30,30], "Temperature", "C")
mySounding.addField('dewPointTemperature', dewPointTemperature[0,:,30,30], "Dew Point Temperature", "C")

mySounding.quickPlot()
The profile plotting capabilities are described in greater detail in the next chapter: Profile Plotting